
If you run a marketing agency, lead generation agency, creative agency, automation agency, or consulting and service firm with repeatable workflows in the United States, you already track ROI on client campaigns every day.
The same question applies to your own operations: when you invest in a custom internal tool, whether a reporting dashboard, client portal, proposal generator, or automated workflow system, how quickly does it pay for itself?
Industry benchmarks for custom internal tools and agency-focused systems in 2026 show that most well-scoped projects deliver positive ROI within 6 to 12 months. Some focused tools reach payback in as little as 4–8 months through labor savings and reduced SaaS spend alone
For context on typical costs, read our earlier guide:
How Much Does It Cost to Build a Custom Internal Tool for Your Agency in 2026?
For realistic build timelines, see:
How Long Does It Take to Build a Custom Internal Tool for Your Agency in 2026?
And for client-facing solutions specifically:
How Much Does a Custom Client Portal Cost for Agencies in 2026?
Typical Payback Periods by Project Type in 2026:
Here is a breakdown based on current benchmarks for agencies like yours:
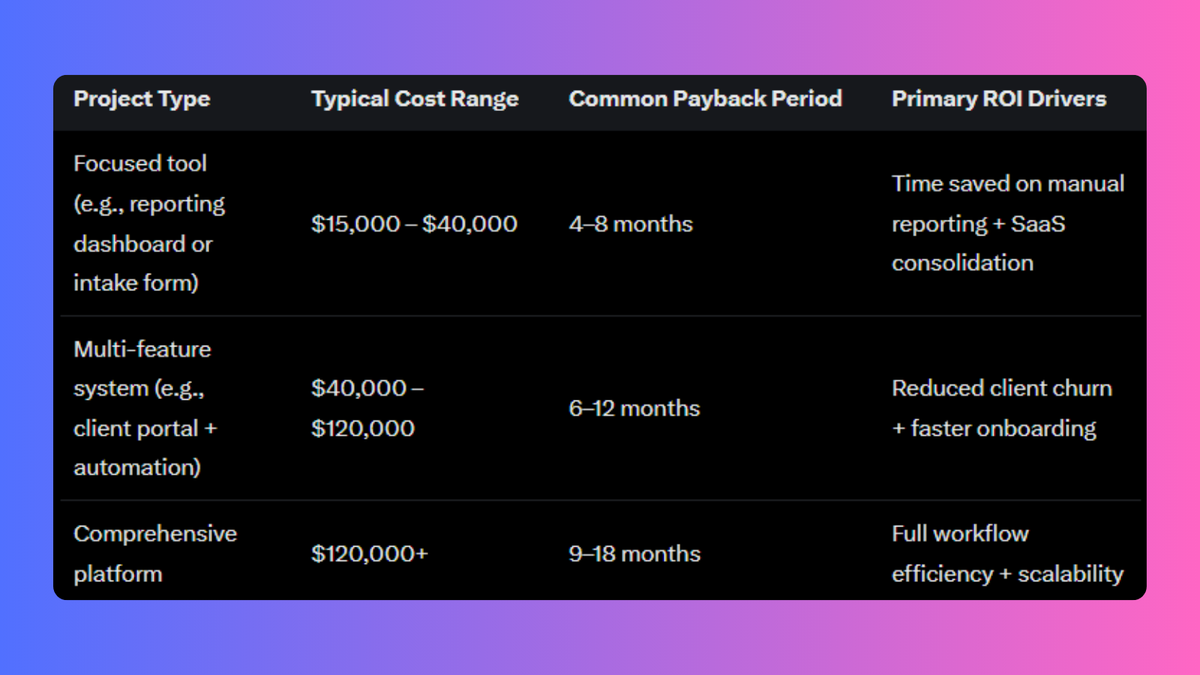
These ranges reflect real 2026 development data for service firms. Payback accelerates when the tool replaces multiple overlapping SaaS subscriptions (often $3,000–$8,000 per month) plus the hidden cost of manual workarounds.
How to Calculate ROI for a Custom Internal Tool (Simple Framework)
You do not need complex spreadsheets to run the numbers. Use this straightforward approach that many U.S. agencies apply:
- Identify current costs
- Monthly SaaS spend on tools the new system will replace
- Hours per week spent on manual tasks (reporting, onboarding, proposals, data entry) × fully loaded hourly rate (typically $40–$70 for agency team members)
- Cost of errors or delays (e.g., lost client renewals or scope creep)
2. Estimate post-tool savings
- Time saved per week (benchmarks show 10–20 hours common for reporting or onboarding automation)
- SaaS subscriptions eliminated or reduced
- Secondary gains such as improved client retention or faster project delivery
3. Apply the basic ROI formula
ROI = [(Total Savings Over Time − Initial Investment) ÷ Initial Investment] × 100
Example using realistic 2026 numbers:
A $25,000 focused reporting dashboard that saves 12 hours per week at $50/hour = $600/week or roughly $31,200/year in labor savings. Add $2,000–$4,000/month in consolidated SaaS fees and the tool often reaches break-even in under 7 months.
What Drives Strong ROI for Agencies
Several factors consistently improve payback for marketing, lead gen, creative, automation, and consulting firms:
- Targeting high-volume repetitive tasks (client reporting, proposal generation, onboarding)
- Replacing 4–8 overlapping tools like Zapier, generic CRMs, or basic portals
- Improving client experience through branded, real-time visibility (often leading to higher retention)
- Starting small with one workflow before expanding
Benchmarks from 2026 internal tool and automation reports show that agencies focusing on these areas see faster returns than those attempting full-platform builds upfront.
Custom Tool vs. Alternatives: ROI Comparison
Here is how the main options compare on total cost of ownership in 2026:
- Custom development (DataStaq AI approach): One-time investment with full ownership. After payback, ongoing costs are mainly maintenance (typically 15–25% of build cost annually).
- No-code/low-code platforms like Retool or Bubble: Lower upfront but recurring per-user or per-app fees plus time spent on workarounds as needs grow.
- Off-the-shelf SaaS like Zapier, Agency Handy, or Moxo: Quick start but monthly fees compound and manual processes often remain. Many agencies report $36,000–$96,000 annual spend across fragmented tools.
- Doing nothing: Continued labor waste and error costs that compound over time.
Custom tools frequently deliver the strongest long-term ROI for agencies with repeatable workflows because the system is built exactly for how your team operates.
Red Flags That Signal Weak ROI
Watch for these when evaluating options:
- A proposed tool that does not clearly target your highest-cost operational friction
- Quotes that ignore data cleaning/migration effort (a frequent hidden cost)
- Solutions requiring heavy ongoing manual maintenance or workarounds
- No clear discussion of post-launch support and how updates will be handled
The strongest ROI comes from projects with clear scoping that address measurable problems.
How to Run Your Own ROI Numbers Quickly
To get a personalized estimate:
- List your top 2–3 operational bottlenecks and the time or cost they currently create
- Note your current SaaS stack and monthly spend
- Identify the number of team members or clients affected
At DataStaq AI we specialize in custom internal tools for marketing agencies, lead generation agencies, creative agencies, automation agencies, and consulting firms across the United States. We help agencies run these exact calculations during a strategy call so you can see the potential ROI before committing to anything.